Displaying all posts with the green infrastructure tag.

How to Incorporate Natural Disaster Preparedness into your Management Plan

Each year, millions of urban trees are destroyed by storms and other natural disasters. With urban populations on the rise and the increasing role of climate change in natural disasters, it is critical that communities prepare for extreme weather as it relates to trees and green infrastructure. Preparing involves not only implementing effective mitigation strategies, but also developing response and recovery plans.

Take 2012 Hurricane Sandy, the deadliest and most destructive hurricane of the 2012 Atlantic hurricane season, and the second costliest hurricane in U.S. history. The hurricane affected 24 states and the devastation was widespread. Trees were especially vulnerable in regions not accustomed to storms of this magnitude. Nearly 20,000 public trees in New York City were destroyed in the wake of the hurricane, which amounts to more trees lost in the city than in any other storm for which tree damage was documented. The NYC Parks and Recreation Department estimated tens of thousands more trees were flooded, left partially uprooted or otherwise compromised in ways not visible to the naked eye. For years following Sandy work was still being done to clean up downed trees and replanting efforts continue into present day.

Communities with more advanced urban forestry programs typically have complete tree inventories, tree canopy goals and management plans to help sustain the tree population. These core components provide a solid foundation for developing hazard mitigation and response plans in the event of a storm or other disaster. There are many different strategies for reducing both the damage and costs associated with natural disasters without taking down trees. In fact, during most storms with winds below 40 mph, trees in good condition are a net benefit and help moderate climate extremes. We’ve outlined some key considerations and proposed actions below.

Mitigation

Trees down on West 90th St. in New York during the brunt of Hurricane Sandy. (Photo by Robert Caplin)

We recommend implementing practices that reduce the potential for damage including annual inspections, structural pruning, selective removal and planting site-appropriate trees based on species, condition and location. These types of proactive management activities help communities more easily identify high-risk trees as part of day-to-day operations.

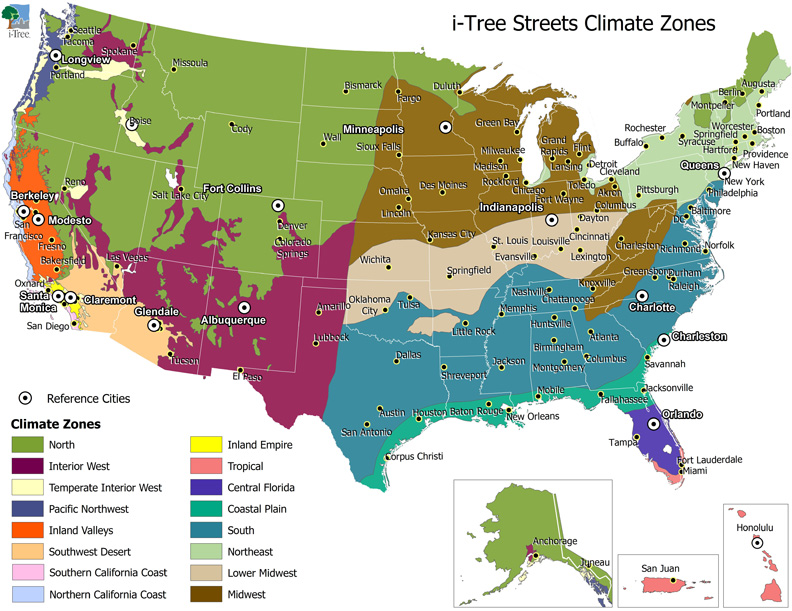
Tree inventories and canopy analyses are an important tool for communities to collect and manage data on the urban forest. Not only do inventories provide a baseline of tree and planting site-specific data, they can help communities identify mitigation strategies to improve resilience. The U.S. Forest Service (USFS) developed the iTree software to provide communities with a free tool for analysis and benefits assessment of the urban forest, which along with OpenTreeMap represent two of the inventory mapping solutions available today.

Additionally, many communities have development hazard mitigation guides. For example, New York City’s Emergency Management Department compiled a guide that outlines key features of the city’s risk vulnerability, assesses a range of hazards (i.e. flooding, earthquakes, water shortages, strong windstorms and the pandemic flu) and presents strategies for managing risks associated with those hazards.

Pre-Planning

While no disaster is the same, communities with post-disaster recovery plans and established contracts for required work can begin recovery efforts more quickly. Pre-planning ensures there is a process in place for debris estimation and management, hiring of contractors and restoration. By identifying and prioritizing the areas that present the highest risk – power lines, public rights-of-way, high traffic areas – cities can focus limited resources on work that will have the greatest impact.

Utility companies can also play a critical role by creating a Vegetation Risk Management Plan (VRMP), to ensure public safety, maintain optimum urban tree canopy, promote tree health and decrease emergency management costs.

Disaster Response

Over 300 trees were lost after Hurricane Sandy in Central Park in New York City.
(Source: A Walk in the Park)

After Hurricane Sandy, New York City’s first priority was to clear trees from highways and streets to provide access to fire trucks and ambulances. Only after roads were clear did tree crews turn their attention to city trees that collapsed on houses and other buildings. Though some of the fallen wood was in good enough condition to be repurposed into building materials, much of it was shredded into mulch in an effort to expedite cleanup and avoid spreading invasive insects.

Less than a month following the Hurricane and ensuing northeaster, more than $12 million had already been spent on tree clean-up. Tree debris can be one of the most expensive aspects of storm response and if not addressed immediately can leave a community with even more expensive restoration costs. It’s important to note that costs can be exacerbated by unnecessary tree removal following a storm and by risks associated with damaged but not fallen trees.

A woman photographs a downed tree damaging several cars after Hurricane Sandy made its way through Brooklyn, New York. (Source: EPA)

The American Planning Association (APA) recommends developing a process for assessing debris with emergency management personnel to ensure the debris and wood residue is managed for its highest and best use. The APA also advises communities to require tree risk assessors during emergency response and recovery operation to have additional qualifications beyond those qualifications required for general pruning and removal contractors.

Post-Disaster Recovery

Crews from all over the country came to New York City to help remove fallen trees. Pictured here a crew from Gainesville, Florida clears a property in Queens. (Source: Marcus Yam, The New York Times)

Hurricane Sandy marks the first time forest systems in the northeast experienced saltwater flooding. The long-term effects of both flood and structural damage are not always immediately visible. In New York City, for example, the parks department inspected inspected nearly 48,000 trees in flood zones in the spring following the storm. More than 6,500 trees showed signs of stress and abnormal leafing and another 2,000 were presumed dead; these trees were completely healthy the previous year.

Disaster recovery does not happen overnight and longitudinal studies are important to determining a storm’s long-term impact on the tree population. As recently as this year, NYC Parks is exploring whether stress on trees from saltwater damage left them more vulnerable to other pests and disease, including a fungal growth recently found on many London Plane trees. Across the Hudson River in New Jersey, state officials are partnering with municipalities to distribute free seedlings to replace trees destroyed in the hurricane.

Conclusion

Trees are a form of green infrastructure, and like all other city infrastructure they provide value to residents in this case in the form of environmental, economic and social benefits. However, unlike other infrastructure, trees grow over the course of many years yet can be destroyed in a single event. Furthermore, healthy trees increase in value with age. That is to say, as trees grow the ecosystem benefits they provide including improved air quality, reduced stormwater runoff and carbon dioxide removal increase. The increase in value of a tree overtime makes regeneration a critical issue following a natural disaster.

In order for the urban forest to be adequately addressed in disaster management and recovery, it needs to be a local priority. Education and community engagement at the local level further support the mitigation of urban forestry related hazards. Communities must also advocate on for increased funding and attention for urban forestry-related issues at the state level, as states ultimately are the primary decision maker in matters related to hazard mitigation.

Has your community experienced a significant storm or other natural disaster? What were some of your biggest challenges? We would love to hear from you and give people the opportunity to learn from your story.

How to Geocode Address-Based Tree Inventory Data

Mapping your trees is the first step to making more informed urban forestry management decisions. Displayed here is a map of trees across Los Angeles County.

Tree inventory data helps municipalities create urban forest management plans, allocate funding and proactively manage trees to ensure their long-term health. Most tree inventory and mapping software platforms require data to be geocoded, yet many municipalities and nonprofit organizations only track the postal addresses of their trees.

In this post, we will outline how you can geocode your address-based tree data without an expensive geographic information system (GIS) or technical expertise. Geocoding refers to the process of assigning longitude and latitude information to addresses so they can be placed as points on a map.

Why geocode your address-based tree data?

Having address data on your trees is important in order to find the general tree location. We plug addresses, not coordinates, into our GPS in order to find a place. However, geocoded data is important for identifying trees once you’re at a specific location. In both urban and rural settings it is common to find multiple trees of the same species at one address, which can make it difficult to locate a specific tree without additional identifying information.

Not only do maps make it easier to locate a tree in the field, they also help us identify actionable insights and make more informed management decisions. Unlike a spreadsheet of tree data, a map of your trees can help you track the spread of pests and disease, visualize how mature trees are dispersed across your city and identify which areas have the highest tree mortality rates. Additionally, the more people involved in maintaining street trees, the more helpful maps are in coordinating volunteers and municipal employees, and updating key information.

After you go through the process of geocoding your address data, all trees listed at the same address will have identical longitude and latitude. You will need to update this data either in the field or using satellite data as a reference to reflect the exact location of a tree at a particular address.

How does geocoding work?

Most simply, geocoding is performed using a reference layer. The process involves matching the to-be-geocoded addresses from your spreadsheet to the street names and address ranges in a street network file. The system matches the street name in your spreadsheet to a reference table and map. Once the street name is matched, all address ranges for this street are examined to identify the specific segment of a street where the address is found. Since the geocoder knows the coordinates of the endpoints of each street as well as the range of street numbers for a given segment, the software can estimate the address coordinates. Most geocoding services place trees at the front and center of the parcel with the associated address. However, some more advanced services allow you to choose how far off the center point of the adjacent road you want to place a given point.

Once you have geocoded tree data you can upload your data to mapping platforms like Carto, QGIS or OpenTreeMap. Carto and QGIS are not industry-specific; however, OpenTreeMap was designed specifically for mapping urban trees and green infrastructure.

Texas A&M offers free geocoding services for up to 2,500 addresses.

Using Texas A&M’s Geocoding Service

We’ll walk through the steps for using Texas A&M’s geocoder, which allows you to geocode 2,500 records for free. There are numerous other services available, however, many require technical expertise and/or software licenses. Texas A&M’s geocoder allows you to upload a database (access file) or text file (csv, tsv) of address data to their website and generate latitude and longitude values. The system can geocode thousands of records in minutes.

Geocoding Instructions

  1. Create an free account with Texas A&M GeoServices.
  2. Navigate to the Batch Geocoding page of their website. Click “Start – Step 1>>.”
  3. Click “Add New Database.”
  4. Click “Upload New Database.”
  5. Choose the file from your computer and designate the type and click Upload. For this example, we used a comma separated values (.csv) file. Make sure to follow the file naming notes listed on their website and include column names in the first row of your spreadsheet or database.
  6. Once you validate that the geocoder can open and read your file, choose the columns from your file that want to process. The required fields (“Address”, “City”, “State”, and “Zip”) must be present in your database or file even if these fields are blank. The system will not process records without these fields present.
  7. Use the dropdown lists to identify the fields in your table that correspond to the input fields the geocoder expects to see. Make sure to only select each of your fields in a maximum of one dropdown.
  8. Choose your processing options and Click “Start Process.” Rather than wait to view your results you can opt-in to receiving status notifications via email. You will receive an email with a link to download your geocoded data once the process is complete.

A spreadsheet highlighting the four columns created after the geocoding process was complete for Rehoboth Beach, Delaware.

In the spreadsheet above, we have highlighted the four columns added after the geocoding was completed. You can reference Texas A&M’s website for additional technical details on how the longitude and latitude results were generated and explanation of the values for the “MatchType” column.

We took the newly geocoded data and uploaded it to the three aforementioned mapping platforms: Carto, QGIS and OpenTreeMap.

First we mapped Rehoboth Beach’s trees using QGIS, a free and open-source desktop geographic information system (GIS) application.

Second, we mapped Rehoboth Beach’s trees in Carto, a cloud computing platform that provides GIS and web mapping tools for display in a web browser.

Lastly, we plotted Rehoboth’s trees in OpenTreeMap, a cloud-based software for mapping and managing trees and green infrastructure.

The less accurate information you have on tree location, the higher the chance the wrong maintenance task is performed on the wrong tree. At best, this results in the misallocation of finite resources and at worst potentially removing an otherwise healthy tree. With geocoded inventory data you are on your way to making more informed management decisions that ensure you are allocating resources as efficiently as possible.

While it is much easier and less expensive to build a map with existing data that requires some modifications than reshoot your entire inventory using a GPS device, moving forward we recommend you use a mobile mapping application or portable GPS device so that you can capture detailed location information at the time of planting, and don’t have to rely on a third party to maintain your database. We also recommend checking and adjusting tree locations as part of routine fieldwork.

Run into snags following our geocoding instructions? Want to learn more about different mapping options? Drop us a line at [email protected]. We’d love to hear from you.

Transplanting Large Caliper Trees in Goderich, Ontario

The original article was written by Michael Ormston-Holloway BSc, MScP, GDHort, MLA, ASLA, CNLA, ISA Certified Arborist of The Planning Partnership (TPP) for Cabbagetown ReLeaf. Michael is a Partner at The Planning Partnership (TPP) and works in both landscape and urban ecology. In addition to his work at TPP, he lectures at the University of Toronto in the Daniel’s Faculty of Architecture, Landscape and Design, the University of Waterloo in the School of Planning division of the Faculty of Environment, the University of Guelph, and OCAD University.

Mature trees provide ecosystem benefits that help reduce pollution, lower energy costs, increase property values and reduce stormwater runoff. Moving large trees can be a good strategy for building momentum around an urban forestry project and for preserving large trees that would otherwise be removed due to development. Unlike mature trees, young specimens take years to reach a size that would provide equivalent ecosystem benefits to those of a large canopy tree.

Moving a large beech tree (1850)

People have been moving large trees since the 1850s, if not earlier, in fact, there is evidence of the ancient Egyptians transplanting large trees almost 4000 years ago. More likely than not, the Egyptians discovered that to transplant a tree, the size of a tree’s root ball must correspond to the caliper of the tree. Larger trees require a larger root ball in order to transplant. With that said, the physiological changes that affect a tree during transplant are similar regardless of the size or age of the tree.

Moving a tree (1930)

A tree that has been planted for three or more years has roots that extend well beyond the drip line of the tree. Generally, 60 to 75 percent of an established tree’s root biomass is outside the drip line, meaning that a fully grown tree has roots branching out in diameter equal to two to three times its height.

During transplant, roots are often purposely trimmed back to lateral roots. In response to this pruning, the tree produces more roots and root hairs, increasing the total size of the root ball. Thus, the process of root pruning helps increase the integrity and volume of the root ball, and helps the tree better acclimate to new surroundings, however, root pruning is more widely used on smaller trees. Since roots provide water, minerals and physical support for a tree, problems can arise when the root system of a tree, particularly a large tree, is improperly cut during prior to transplant.

AmericanHort (formerly the American Nursery and Landscape Association) set standards for root ball moving. In general, needled evergreens require a minimum of eight inches of root ball for each inch of trunk caliper and deciduous trees require nine inches of root ball per inch of caliper. After determining the root ball diameter, digging, balling and burlapping by hand help ensure the root ball remains intact.

Hand burlapping and balling large trees in preparation for transplant in Goderich, Ontario.

The Planning Partnership (TPP) is a leading expert in large-tree transplanting methods and has worked with various tree contractors throughout Southern Ontario to move trees 60 ft in height and greater. They worked with the Town of Goderich to redesign and replant their town square park following the F3 (on the Fugita scale) tornado that hit in August, 2011. Goderich, located on the eastern shore of Lake Huron, is home to fewer than 10,000 residents. The 2011 tornado was the strongest tornado Ontario had seen in more than 15 years with wind speeds at 280 kmh (174 mph). While the tornado only lasted 12 seconds, buildings were leveled and trees uprooted or split, leaving the town with $130 million in damages. It’s estimated the town lost more than 90 percent of it’s total tree canopy.

Transplanting a large Metasequoia in Goderich.

Following the tornado, the town worked with TPP to develop a master plan to combat lost tree canopy on public land. As part of their redesign of the central square, TPP transplanted more than 150 (44 small, 93 medium and 20 large) mature trees from around the region. The transformation of the town center following the tornado included the planting of 60′ tall trees with 30′ canopies. In addition to donations from the community, the trees came with an unusually long warranty, which was critical to the Town’s ability to afford mature trees. The successful transplant of the trees was just the first step to ensuring they thrived in their new home. The Town was committed to helping the trees adapt to the new environment through consistent fertilizing and soil treatment.

Did you recently transplant a tree in your town or city? We’d love to hear about it. Send us your story at [email protected].

Additional resources on transplanting trees:

American Standard for Nursery Stock

Colorado Master Gardener Notes on Tree Planting

Clemson Cooperative Extension: Transplanting Established Trees & Shrubs

Recorded Webinar: Tracking Your Green Infrastructure

This week we hosted a webinar with TreeKIT on tracking and measuring the impact of green infrastructure with OpenTreeMap. As climates change and more regions face severe heat and drought, tracking green infrastructure is a necessary first step to measuring its impact and identifying the best locations for additional green infrastructure resources. With OpenTreeMap, you can increase public awareness of the value of green infrastructure and promote community stewardship. For users that provide local data and calculations, OpenTreeMap can also measure the money and water your green infrastructure saves each year.

As part of this webinar, we explored how:

  • OpenTreeMap can be used to gather and maintain data related to rain barrels, bioswales and other features
  • To increase public education of the benefits of green infrastructure
  • To promote installation and stewardship of green infrastructure

Click here for more information on the Green Infrastructure module and sign-up for your 30-day free trial today. You’ll find the full webinar recording below. We’ve also made the slides available on Slideshare. You can reach us at [email protected] with any questions. We hope you’ll join us for future webinars.


Join us November 11 to discover OpenTreeMap’s new Green Infastructure module

Do you wish you could map more than trees? As climates change and regions face severe heat, drought, and weather events, more organizations are promoting innovative techniques to harvest rain water, prevent stormwater runoff, and conserve water in general. OpenTreeMap can assist with managing those initiatives by tracking the location of bioswales, rain barrels, and other water conservation features.

We hope you’ll join us for a webinar on Wednesday, November 11 from 2-3pm EST to discover the new OpenTreeMap Green Infrastructure module.

Deb Boyer, OpenTreeMap Project Manager, will be joined by Philip Silva, Co-Founder and Co-Director of TreeKIT, to discuss how Brooklyn’s Gowanus Canal Conservancy uses OpenTreeMap’s bioswale tracking features to fulfill their mission of increasing environmental stewardship.

During this webinar, you will learn:

  • How OpenTreeMap can be used for gathering and maintaining data related to rain barrels, bioswales, and other features
  • How you can increase public education of the benefits of green infrastructure resources
  • How you can promote installation and stewardship of green infrastructure resources
Space is limited. Click here to register and secure your spot today!

Trees, You, and the Urban Heat Island Effect

It’s Memorial Day weekend, and across the country people are headed outside with shorts, sunscreen, towels, and coolers to mark the start of summer. As temperatures rise, you may be taking steps to keep cool like cranking your AC unit or bringing out a box fan. The summer heat can be brutal no matter where you are, but if you live or work in a large city, you may be facing higher temperatures due to a phenomenon called “the urban heat island effect”.

What is the urban heat island effect?

In cities with populations of 1 million or more, the annual mean air temperature can be 1.8-5.4 °F higher than the surrounding countryside. At night, temperature difference between urban and rural areas can be as much as 22°F apart. Man-made materials such as concrete and metal hold heat and and repel moisture. In the summertime, conventional rooftops may be up to 90*F hotter than the air temperature, and pavements may reach 120-150°F. When many buildings are placed together, an urban heat island is formed.

Heat islands are not only uncomfortable, they are harmful to people and the planet! Energy usage goes up as we try to stay cool. This energy is usually produced from fossil fuels that increase pollution and greenhouse gases. Higher temperatures increase reactions with chemicals found in industrial emissions, car exhaust, and other solvents to create ground-level ozone, which exasperates health problems like asthma.

How can cities combat the urban heat island effect?

There is no single solution to the urban heat island effect. Sustainable energy sources, better building materials, and green design can all help—but in our biased opinion, trees are one of the best answers.

If you’ve ever searched a parking lot for a spot under a tree, you know that shade can make a drastic difference in the heat. In fact, shade can cut surface temperatures by 20-45°F. Strategic planting around buildings to shade windows and roofs can make a big difference in temperatures and energy consumption. Of course, there are many other benefits trees provide as well, such as raising property values and improving air quality. Planting trees is one of the best ways individuals and communities can address the problem.

Before heading out to buy a tree, however, we advocate contacting a local organization that can help you choose the correct tree and correct planting site. Many trees are placed too close to buildings for their adult size and have to be removed. Other times, trees are ill-suited to the soil and environment and fail to thrive. Your local forestry community can provide you with the resources to make the best choices, and they may even provide or plant your tree for free!

Stay cool this summer.


What’s the Science Behind Green Infrastructure Tracking in OpenTreeMap?

When it launched in early 2014, TreeMapLA became our first OpenTreeMap site to support tracking green stormwater infrastructure (also known by the acronym “GSI”, not to be confused with “GIS”!). 26 GSI features – or as TreePeople decided to call them on their map, “Watershed Solutions” – have been mapped on TreeMapLA so far, including rain gardens, rain barrels (otherwise known as cisterns or tanks), and turf/concrete reductions. These 26 features offer over $5,000 a year in savings to Los Angeles from water conservation and reduced stormwater runoff. The capability to map and track GSI features isn’t automatically available in every OpenTreeMap, however, because the scientific calculations used to generate the environmental and economic benefits of the features often require customization for each map. So what’s involved in adding green infrastructure tracking to your OpenTreeMap site?

i-Tree Streets Climate Zones map

Thoroughly researched i-Tree Streets Climate Zones cover the entire US.

The value of trees in reducing stormwater runoff and encouraging water filtration and conservation is well documented and researched. Based on research by the US Forest Service and the publication of the resulting data and algorithms in the public domain i-Tree software suite, we built our own open source tree ecosystem benefit calculation system for use in OpenTreeMap. A user can start an OpenTreeMap site anywhere in the continental United States, add a tree with info on the species and diameter, and instantly have access to the same peer-reviewed ecosystem benefit calculations as they would if they conducted an analysis project with the i-Tree Streets desktop software. For maps located outside of the continental US, such as yegTreeMap and Ecology Ottawa, we can work with a map owner and enable benefit calculations based on an approximate i-Tree Climate Zone for their area. We have always been proponents of open data at Azavea, and OpenTreeMap is an example of exactly the type of innovation supported by open data.

Unfortunately, there is no equivalent, comprehensive “i-Tree-like” software or data we can use to support GSI benefit calculations anywhere in the country. Calculating the environmental impacts of GSI can be just as complex as calculating the environmental impacts of trees. Green stormwater infrastructure can be built for many reasons, including capturing rain and stormwater for use in building and irrigation systems; infiltrating it back into the ground water supply; and preventing it from taxing traditional “gray” infrastructure like sewers and water treatment systems, where it can also be contaminated before reaching our rivers, lakes, and streams.

So to calculate the benefits and impacts of GSI at a basic level, one needs to know how much stormwater a particular location receives! There are numerous climate regions in the US, all with different levels of annual rainfall and precipitation. Different microclimates might even exist within the same city. At a minimum an OpenTreeMap site tracking GSI features would need to draw upon a GIS data layer of precipitation levels in the geographic area covered by the tree map as well as unique parameters and values based on the type of GSI feature (rain garden, rain barrel, green roof, etc).

At a more complex level, different types of land use (commercial and residential zoning areas, for example) might have different water usage patterns and thus benefit more or less from GSI features like green roofs or rain barrels. Some jurisdictions, like Philadelphia, may offer billing credits for green stormwater infrastructure features. The existing amount of impervious surfaces (like concrete or asphalt) in a community and the value placed on removing them might also be a factor to be considered. Finally, the impact of different types of GSI features varies based on how large a catchment area they serve, the tank storage capacity, or other design factors.

In building TreeMapLA’s watershed solutions feature, we were fortunate to work with some very smart people – our partner Kelaine Vargas of Urban Ecos, and Edith de Guzman, TreePeople’s Director of Research – to design a calculation system that took into consideration these many factors.

TreeMapLA’s calculated watershed solution benefits.

Together, we were able to develop and integrate into TreeMapLA calculations for stormwater runoff (gallons and dollar value) and water conservation (gallons and dollar value) metrics for three different types of “watershed solutions” (rain gardens; rain barrels, cisterns, and tanks; and turf/concrete reduction projects).

Process of adding a Watershed Solution on TreeMapLA.

When a user visits TreeMapLA to add one of these watershed solutions, the software guides them through a several-step process to determine and collect:

  • the type of solution
  • the location of the solution (which is connected to info on annual precipitation)
  • for rain barrels, the capacity in gallons of the barrel
  • if applicable, the catchment area or area of replaced turf or concrete associated with the solution
  • if applicable, whether the area was improved with plants and other materials that consume less water
  • if applicable, whether an irrigation system for the area existed, exists now, or was improved for efficiency
  • if applicable, whether excess runoff flows to impervious or pervious surfaces

Based on this data, OpenTreeMap decides to apply one or more equations developed by TreePeople to calculate the amount of reduced stormwater runoff and/or reduced water usage. A flowchart of this process and equations is available here.

“We embarked on this project with the purpose of benefitting other OTM users,” says TreePeople’s Edith de Guzman. Because of this preliminary work with TreeMapLA, any OpenTreeMap.org map can support green stormwater infrastructure at significantly less cost than was required to implement it the first time.

While it requires a bit of extra thinking, it’s absolutely possible to track the impact of green stormwater infrastructure projects using OpenTreeMap.. You could choose to base your map’s calculations off of TreeMapLA’s, or we’re happy to discuss other calculations suitable to your community. We’re also very interested in supporting other types of green infrastructure features such as green roofs, bioswales, and more. Let us know if you have a GSI feature you would like to track.

Even if OpenTreeMap isn’t exactly right for your GSI project, Azavea also has a broad base of expertise in other types of GIS tools and spatial analysis projects related to stormwater and watersheds. We’d love to hear from you!

Sign Up

Want to Try OpenTreeMap?

Create an account in less than two minutes and get a one-month free trial of OpenTreeMap Cloud. It’s that easy.